This briefing note provides insights into the year-end 2025 Solvency and Financial Condition Reports (SFCRs) of selected non-life insurers based in the Netherlands.1 The report includes an analysis of key information included in the Quantitative Reporting Templates (QRTs) published with the SFCRs.2
In this briefing note, we analyse the SFCRs of the 10 largest non-life entities of Dutch insurers, selected based on the volume of gross written premiums (GWPs) in 2025, accounting for 87% of the entire GWP market. The three largest insurers account for 66% of the €20.2 billion total of all GWPs. The 13% shown in the Other category in Figure 1 represents the ~40 non-life insurance entities not considered in this briefing note. The non-life GWP for 2025 has increased by 8% compared to 2024. Furthermore, compared to 2024, a.s.r. has overtaken Achmea to become the largest non-life insurer, and the GWP of ABN AMRO has increased such that it has surpassed DAS and broken into the top 10 largest non-life insurers.
Figure 1: Reported total GWP per YE2025 and YE2024 and as percentage of the total Dutch market (figure in € billion)
| INSURER | GWP 2025 | GWP 2024 | CHANGE | MARKET SHARE (%) |
|---|---|---|---|---|
| a.s.r. | 4.90 | 3.97 | 0.94 | 24% |
| Achmea | 4.52 | 4.35 | 0.16 | 22% |
| NN | 3.98 | 3.77 | 0.21 | 20% |
| Univé | 0.85 | 0.74 | 0.10 | 4% |
| Goudse | 0.73 | 0.68 | 0.05 | 4% |
| NH van 1816 | 0.67 | 0.61 | 0.10 | 3% |
| UVM | 0.64 | 0.57 | 0.03 | 3% |
| TVM | 0.44 | 0.43 | 0.01 | 2% |
| Bovemij | 0.44 | 0.37 | 0.06 | 2% |
| ABN AMRO | 0.34 | 0.31 | 0.03 | 2% |
| Other | 2.70 | 2.89 | -0.19 | 13% |
| Market | 20.20 | 18.69 | 1.51 | 100% |
In addition to the property and casualty lines of business, the presented values include disability, income protection and medical expenses. However, specific entities underwriting medical expenses related to the Dutch Health Risk Equalisation System (Basis en Aanvullende Zorgverzekeringen) are excluded from this analysis.3 The Dutch equalisation system’s health coverages are primarily written in separate entities, resulting in a limited exposure in medical expenses for the remaining non-life insurers in our report.
Analysis of premiums
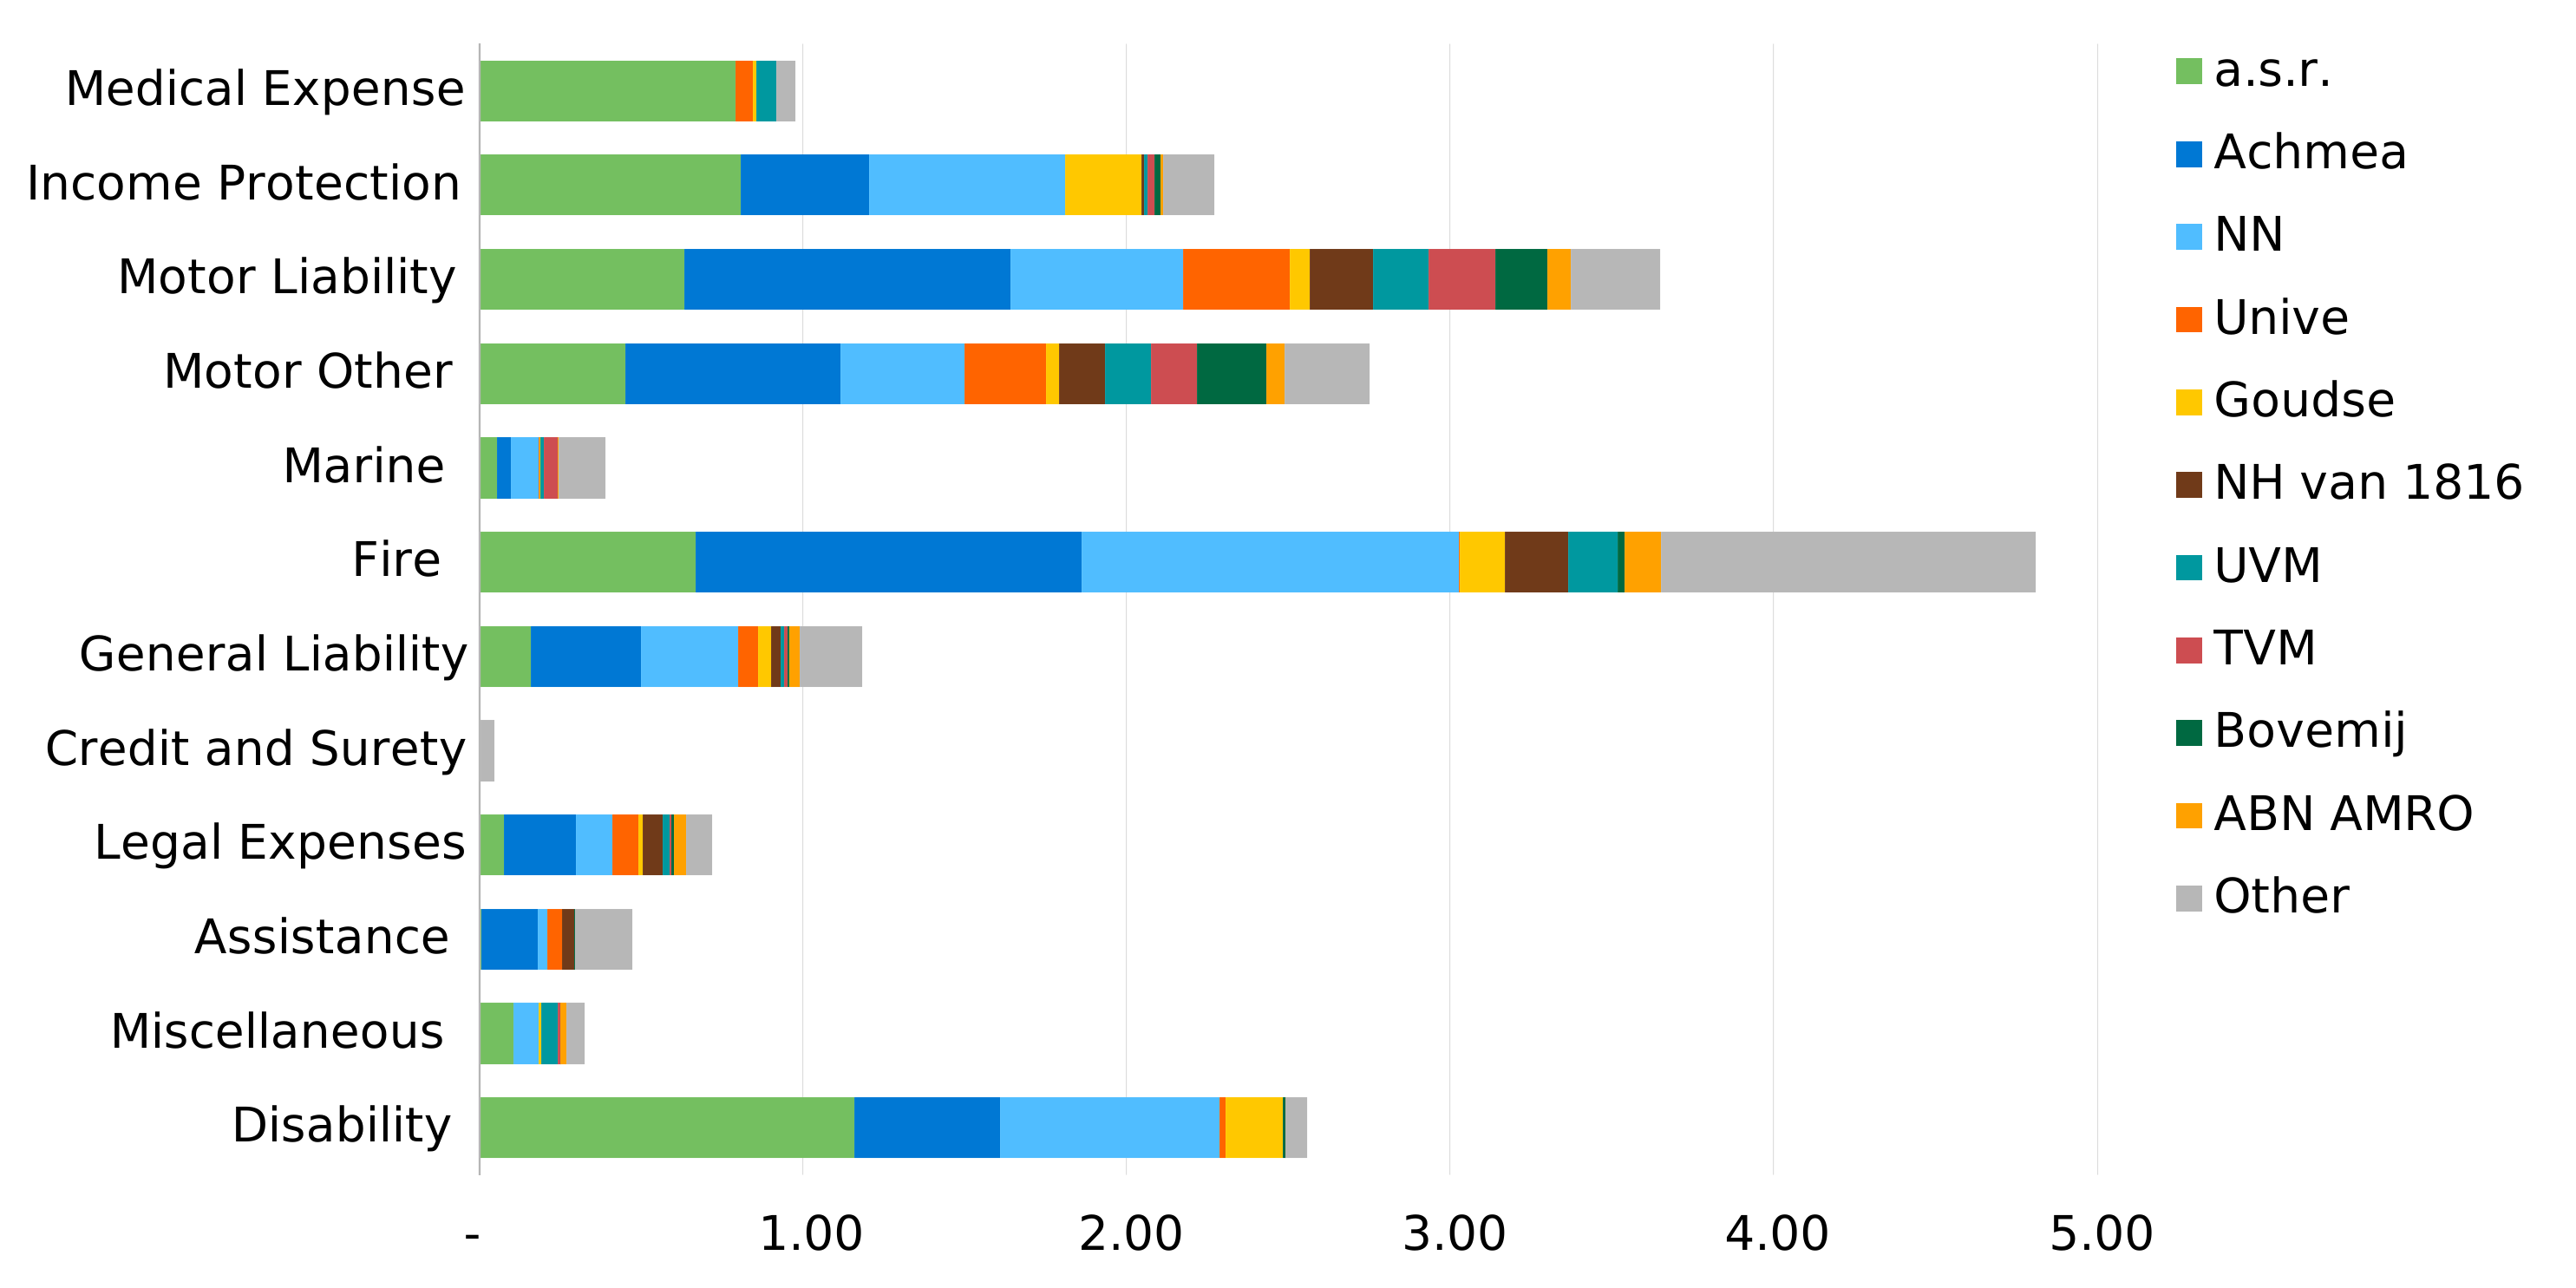
As Figure 2 shows, the largest line of business is fire, followed by motor liability and motor other (representing third-party liability and other motor losses) combined. Together, these three lines of business account for €11.2 billion of the €20.2 billion in total non-life GWP. The medical expense line shows a significant increase compared to 2024 due to a.s.r. transferring part of its health insurance business to its non-life insurer through a reinsurance arrangement.4
Figure 2: GWPs per line of business (figure in € billions)
Combined ratio
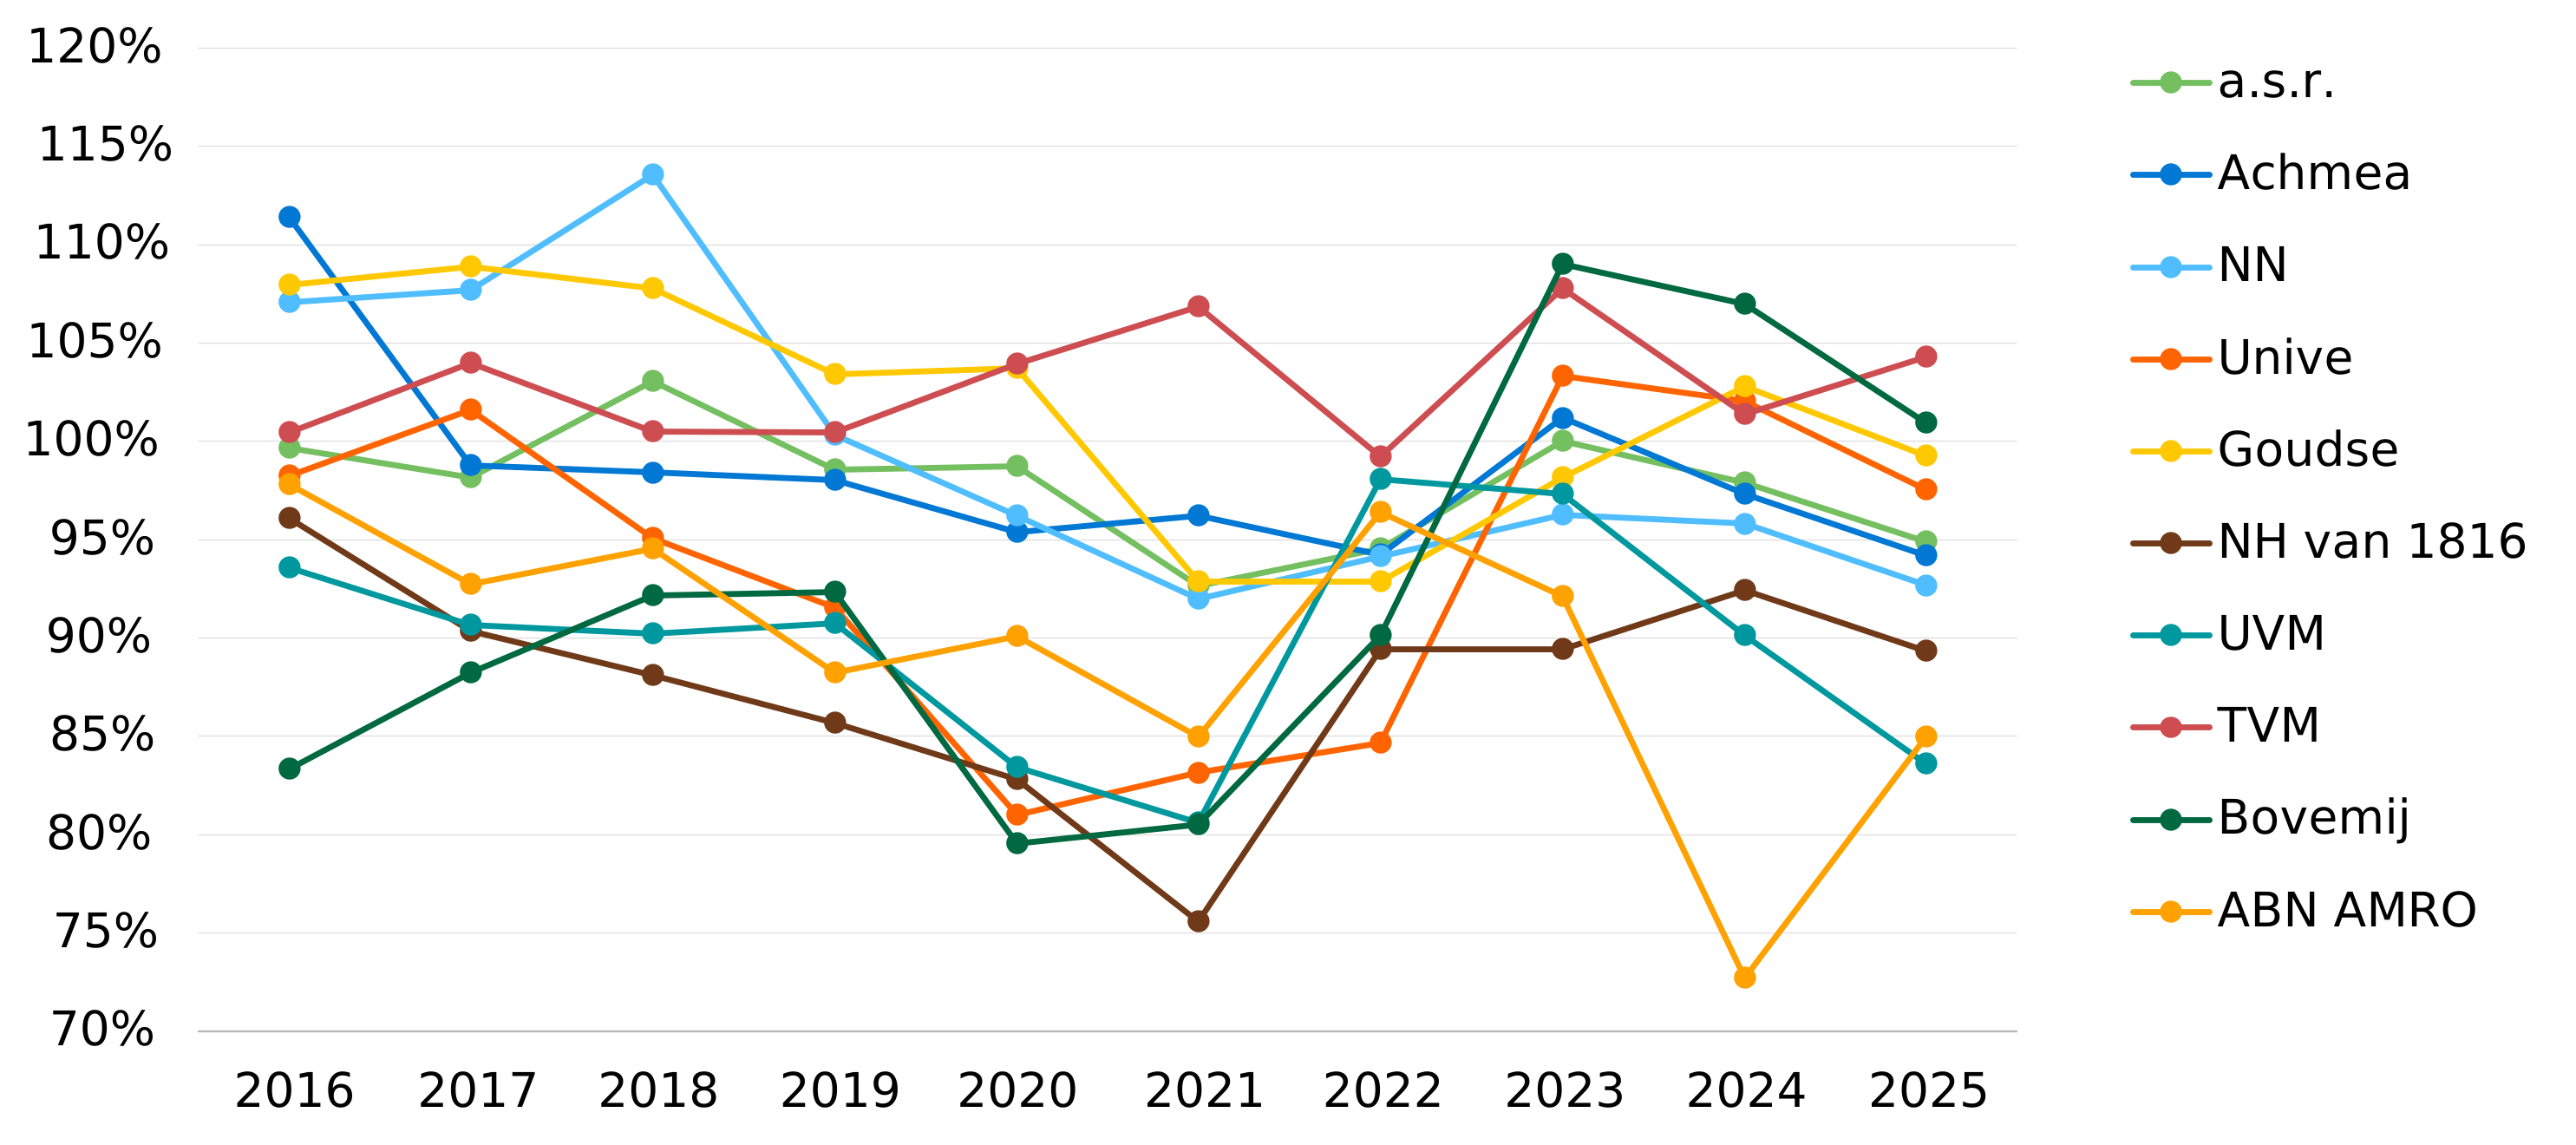
The combined ratio is calculated on financial year basis by dividing the sum of expenses incurred and net claims incurred by the net earned premium. Compared to 2024, the reported combined ratios have decreased for almost all insurers in this selection, except for an increase for TVM and ABN AMRO. The improvement in combined ratios appears to have been partly driven by favourable weather conditions and lower weather-related claims, while premium increases and indexation helped mitigate the impact of claims inflation.
Figure 3: Evolution of the combined ratios over time
Solvency Capital Requirement coverage ratio
The weighted average Solvency Capital Requirement (SCR) coverage ratio for the selected insurance entities was 160% at year-end 2025, up from 156% at year-end 2024. Solvency coverage can change year-on-year for various reasons, including revised capital management strategies. Figure 4 shows the SCR coverage ratio of the companies included in our sample for the past three years.
Figure 4: SCR coverage ratio of the selected insurance entities
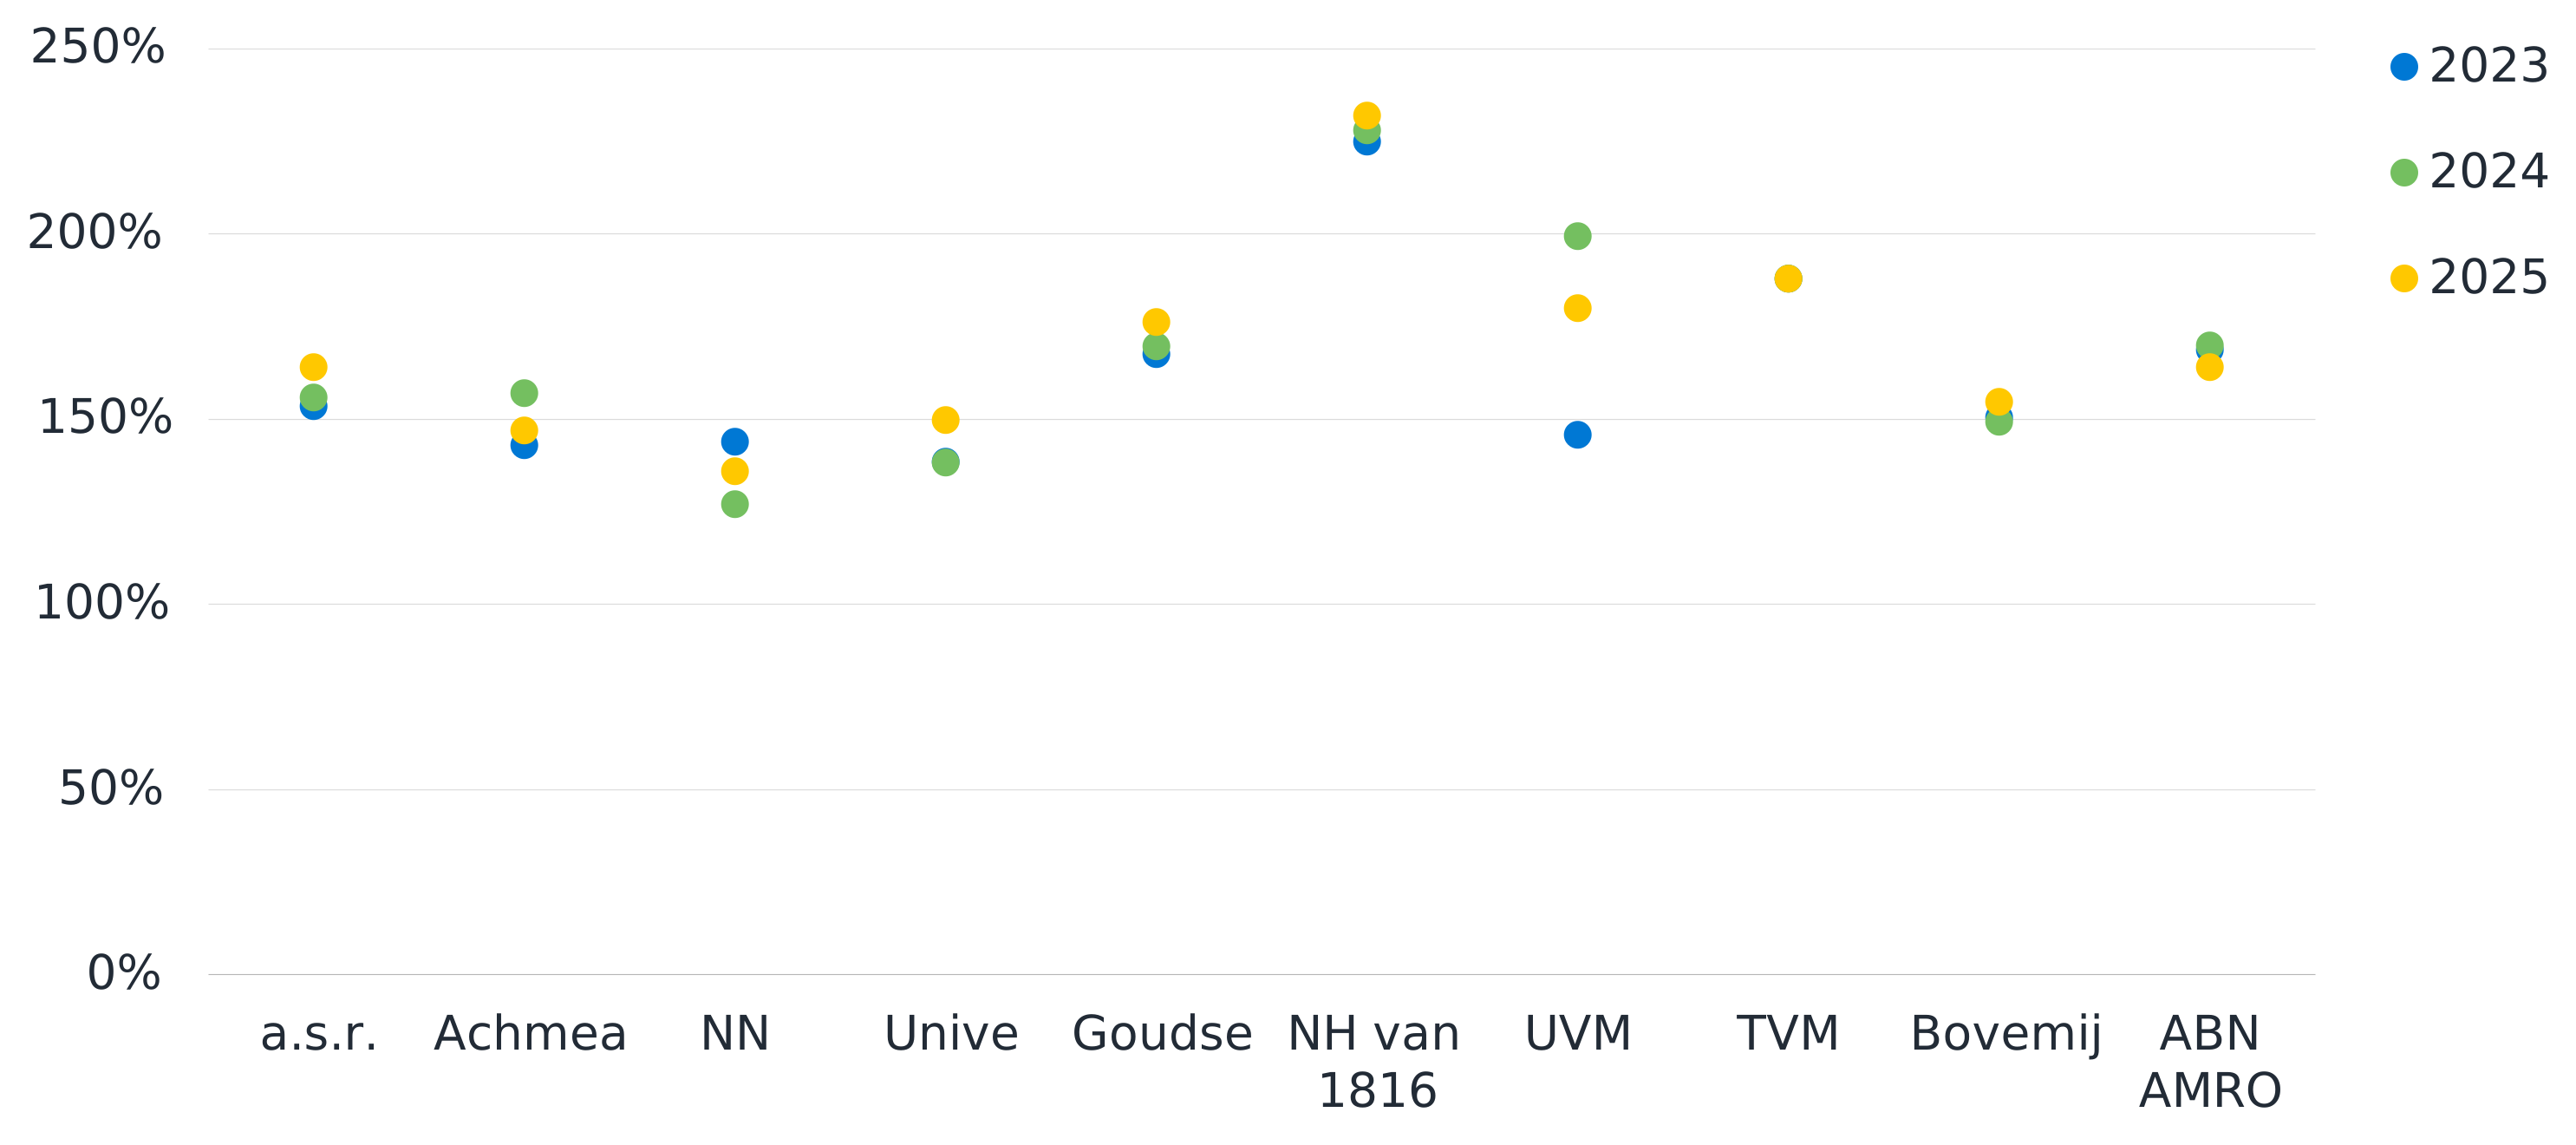
The market SCR coverage ratio amounts to 172% in 2025 (169% in 2024). This shows that non-life insurers based in the Netherlands continue to hold a significant capital buffer—in excess of the required SCR coverage ratio of 100%. Smaller insurers have, on average, a higher SCR ratio, as the weighted average SCR coverage ratio of the selected sample (160%) is lower than the market SCR coverage ratio (172%).
SCR – standard formula
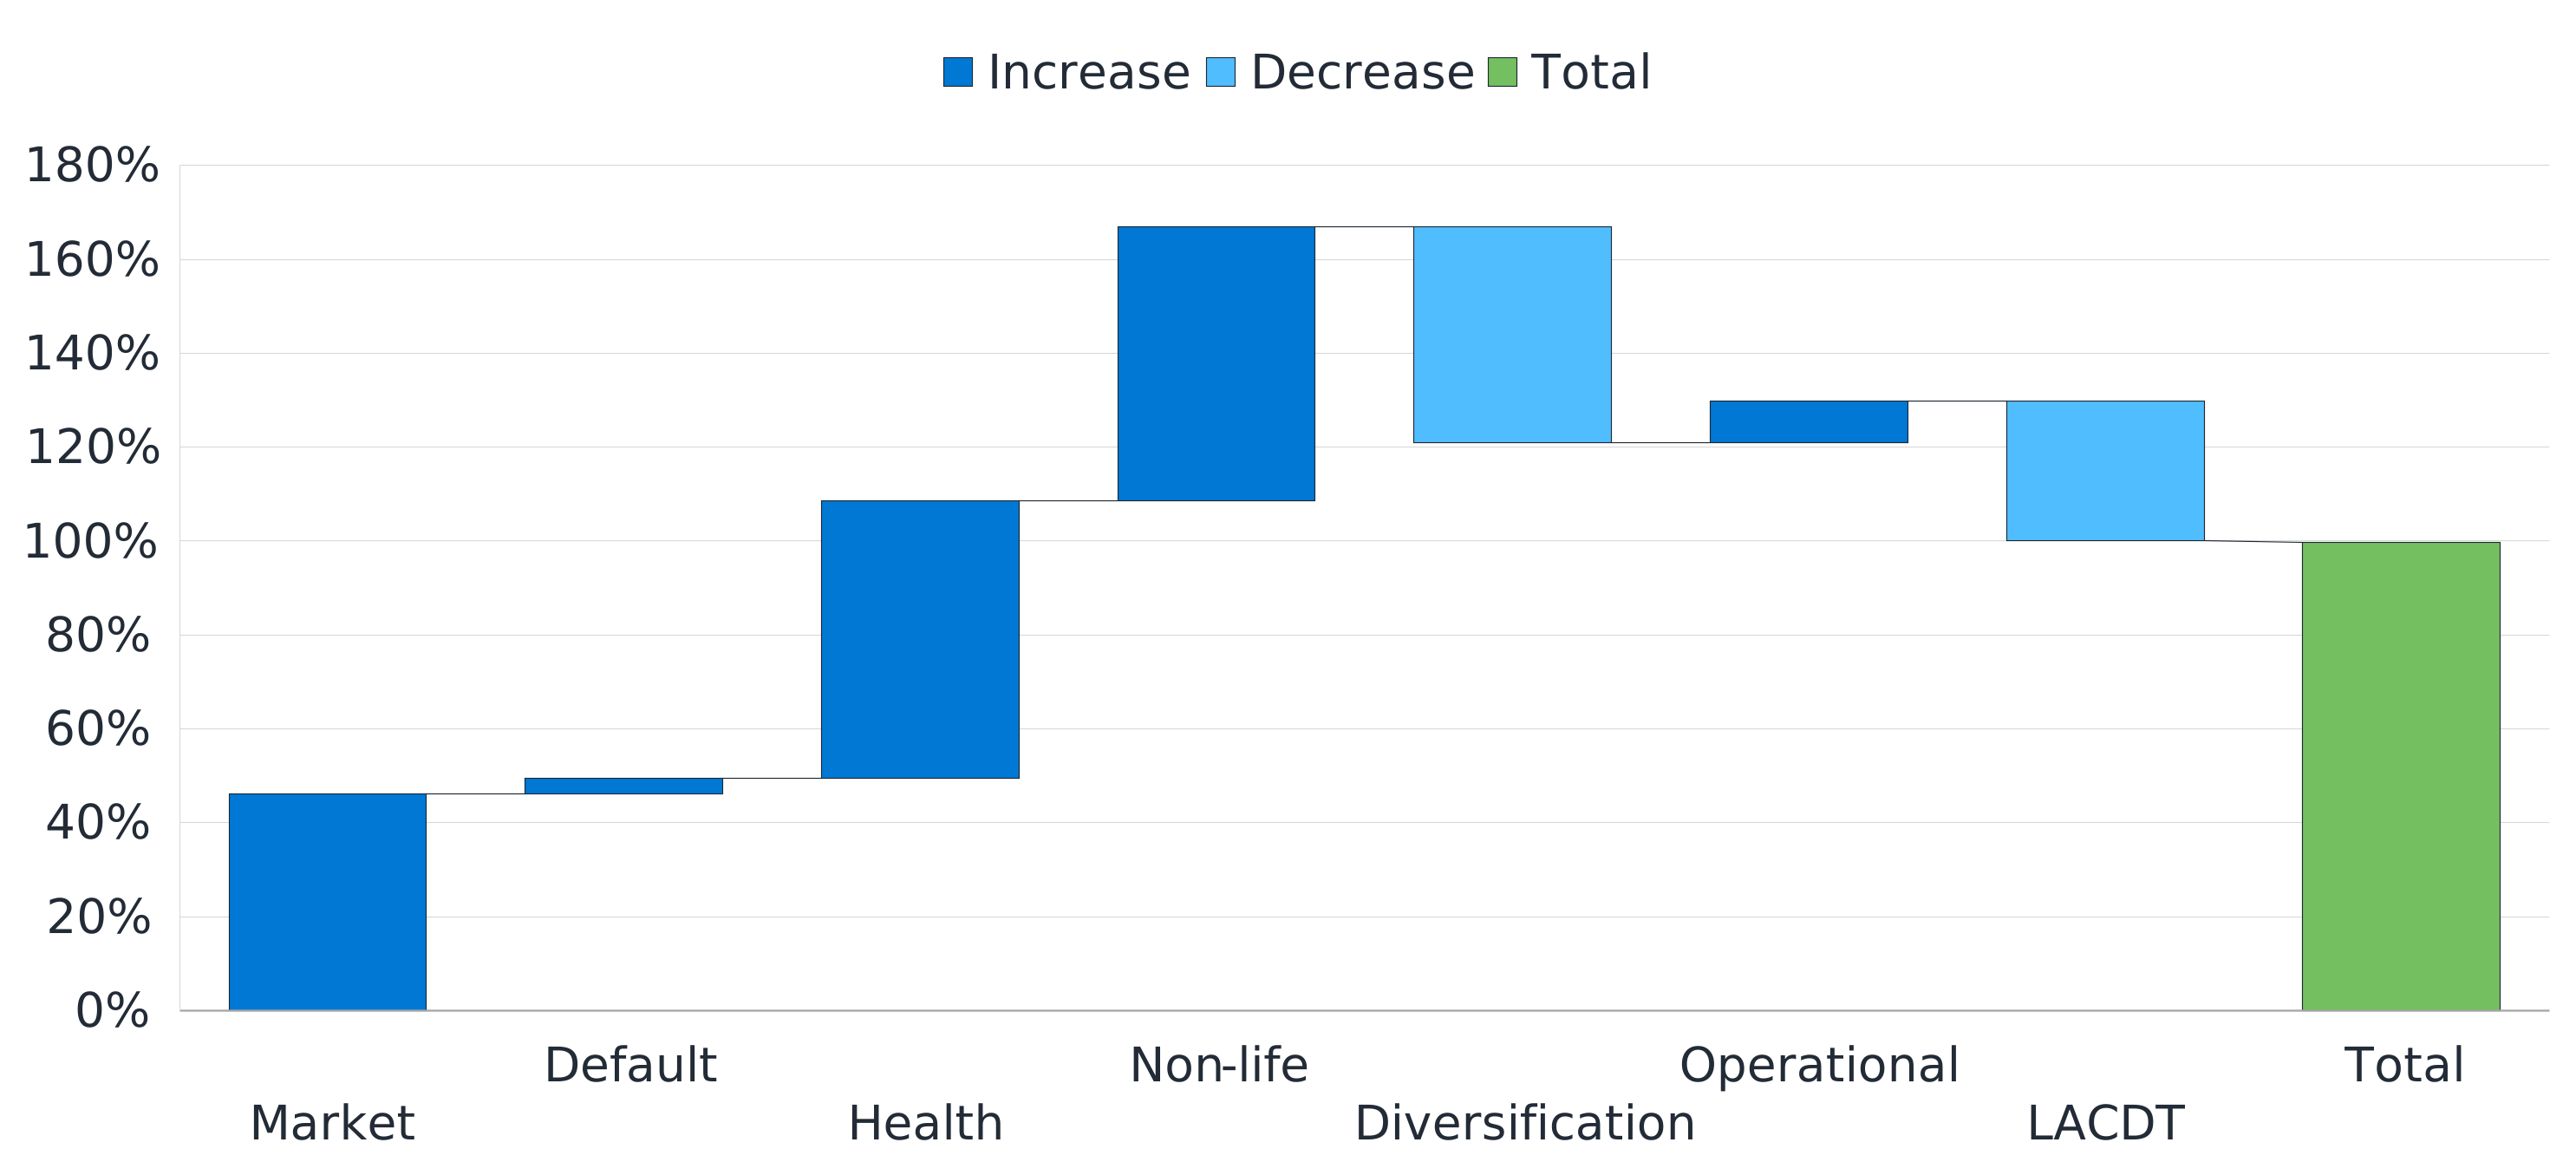
For the companies in our sample, the standard formula SCR5 as of 31 December 2025 is largely driven by underwriting risk, split across health and non-life. The diversification and loss-absorbing capacity of deferred taxes (LACDT) benefits largely offset these risks to reduce the SCR.
Figure 5: Breakdown of SCR under the standard formula of the selected insurance entities
Investments
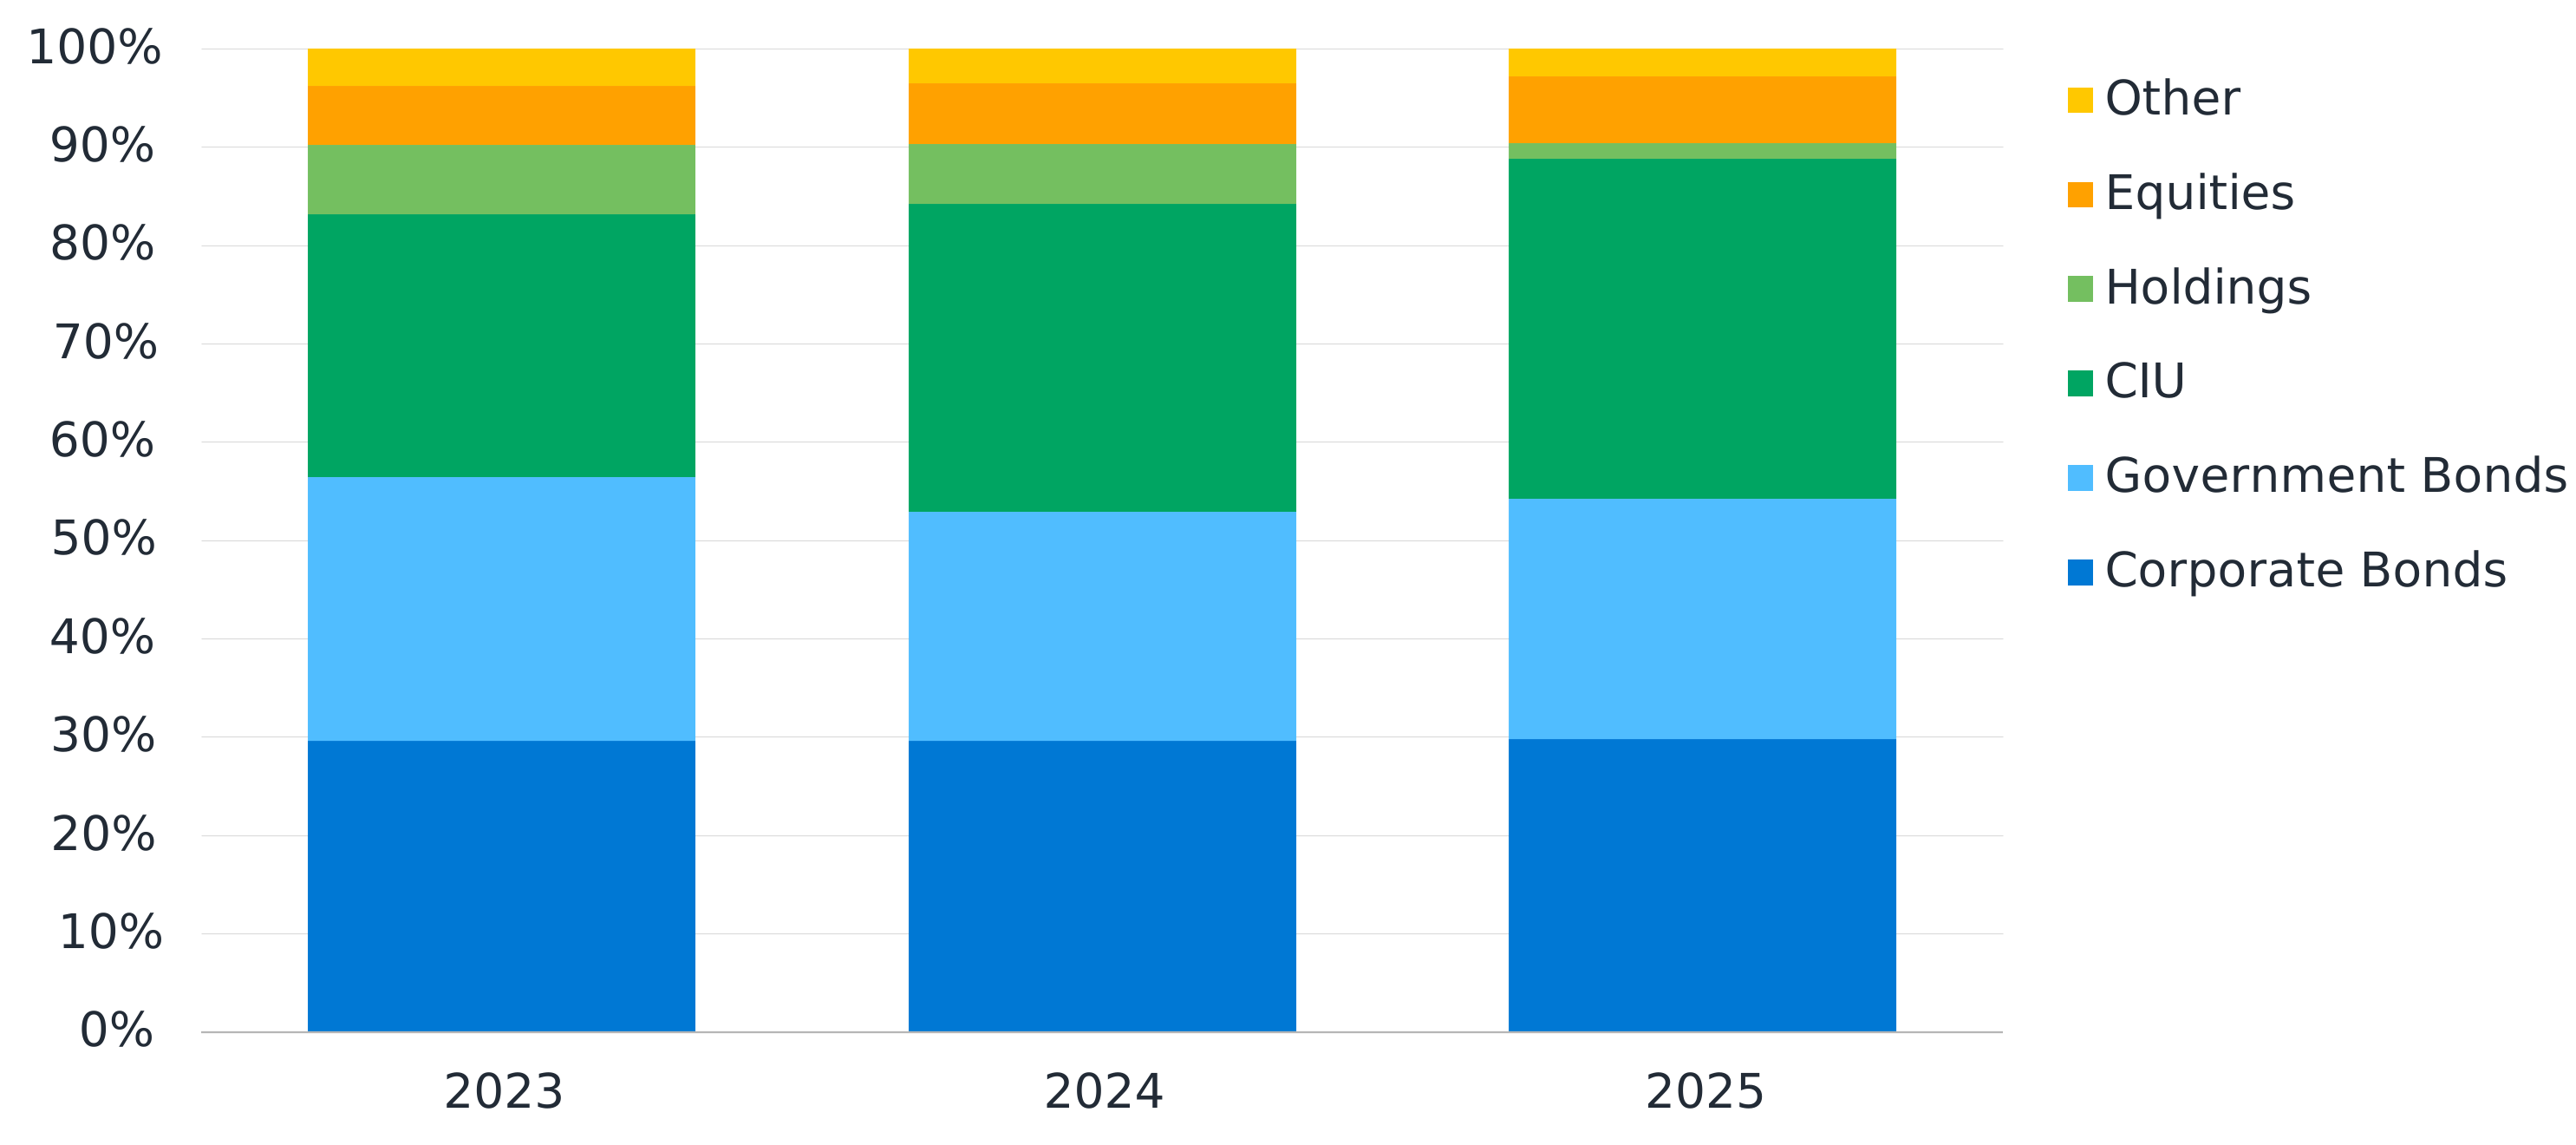
The asset portfolio of the selected insurers comprises 88% of the investments of all Dutch non-life insurers, totalling €26.5 billion in value. Figure 6 shows how these investments can be further categorised. Investments primarily consist of government bonds, corporate bonds and collective investment undertakings (CIUs). Overall, the data show an increase in the share of CIUs over time.
Figure 6: Investment mix of all non-life insurers
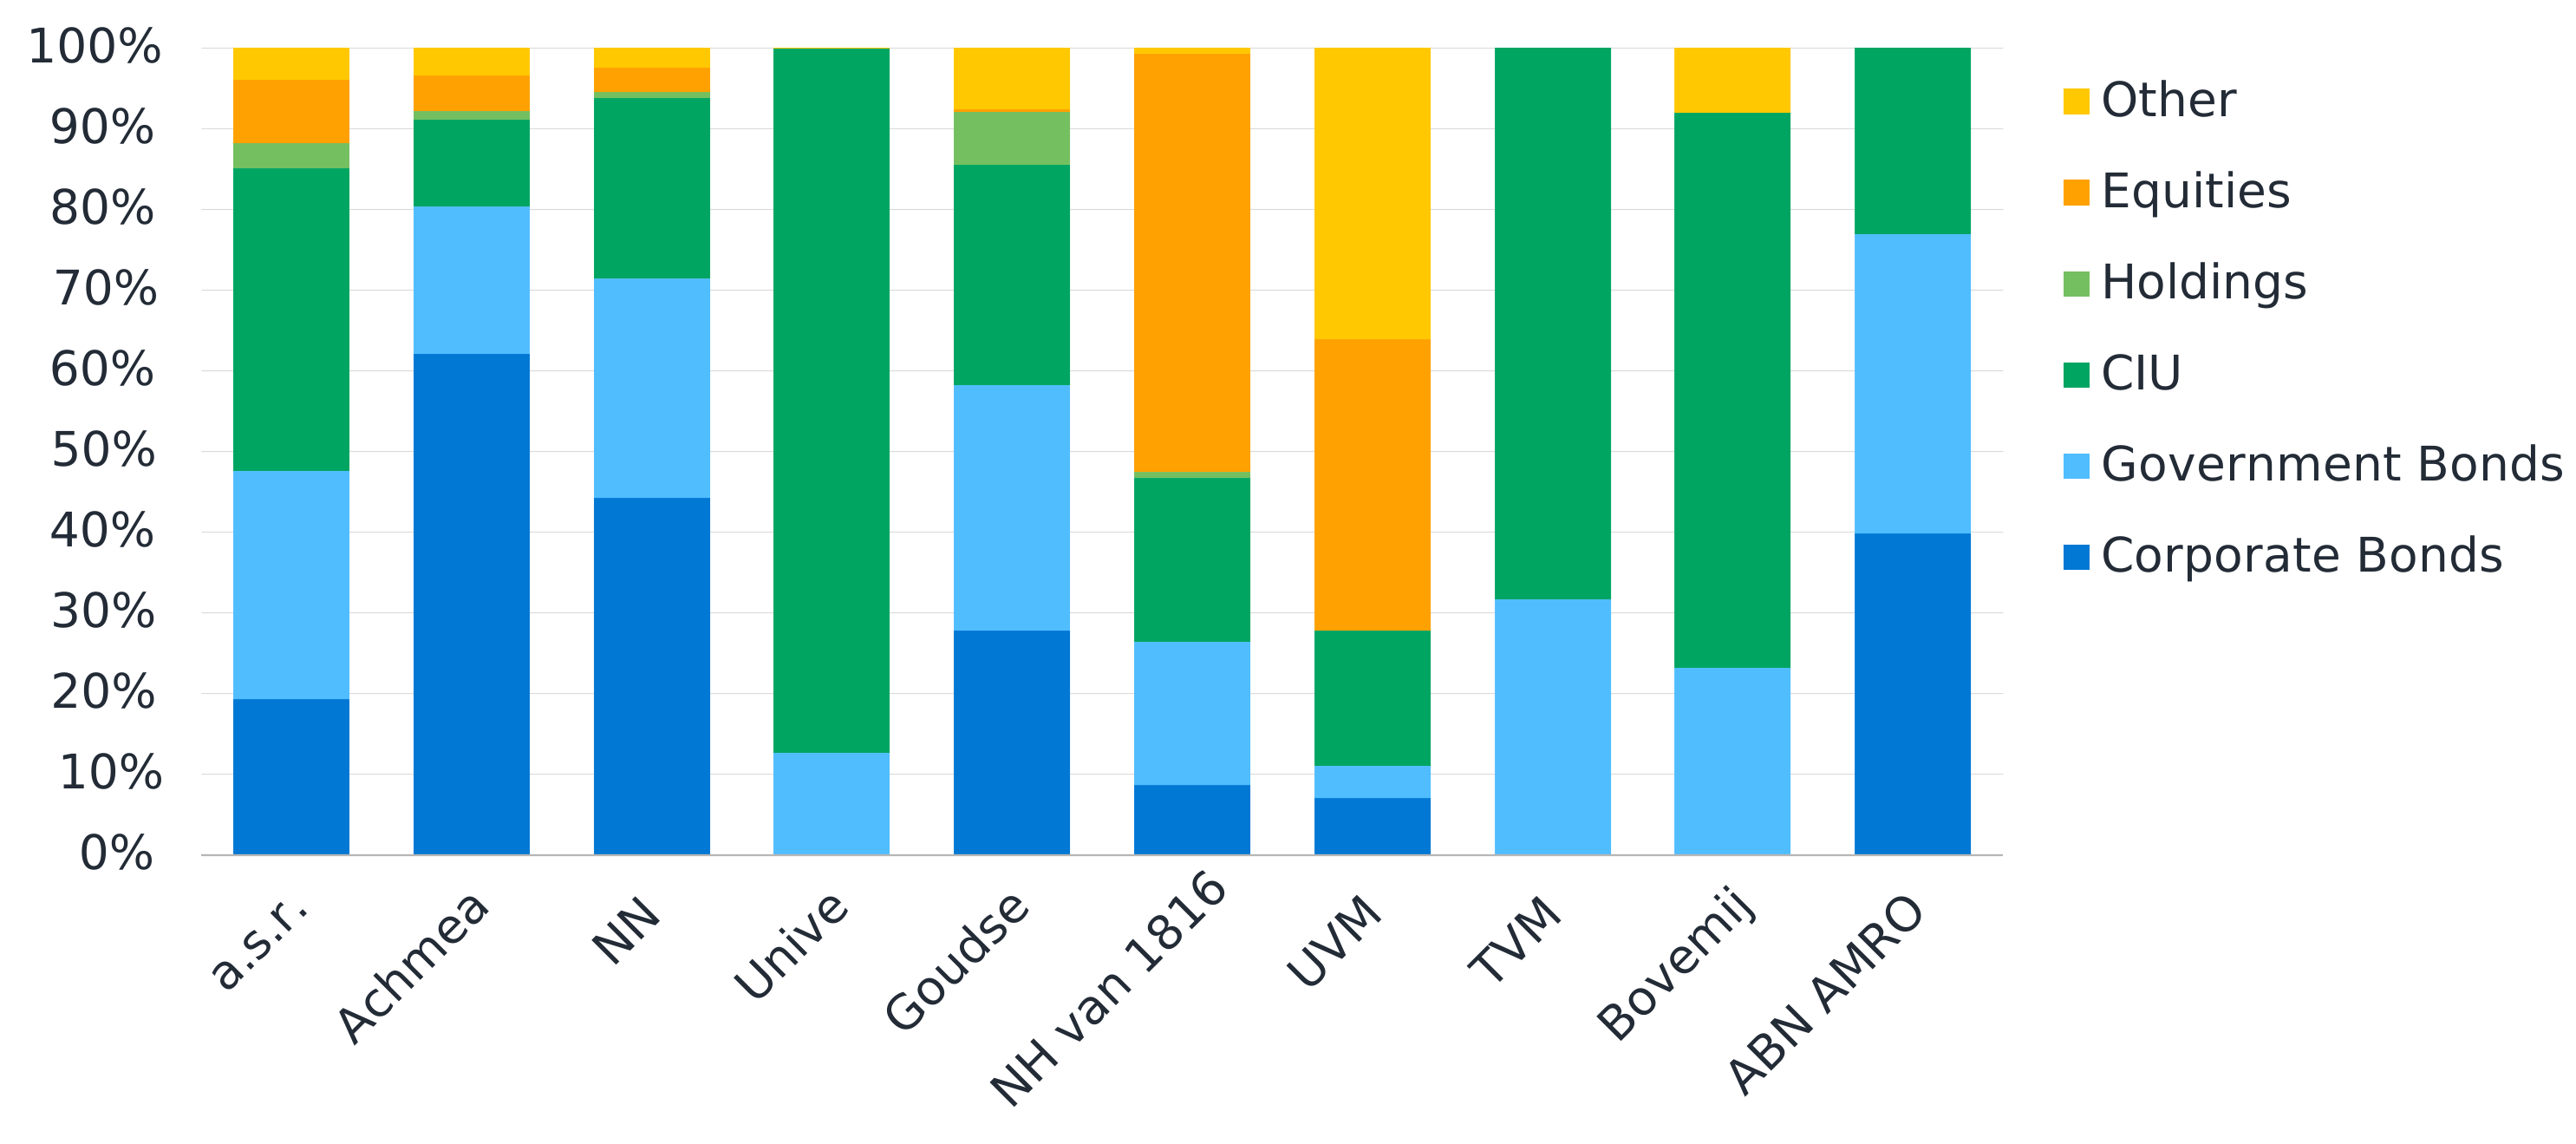
The investment mix of the three largest insurers shows that Achmea and NN have a notably higher share of corporate bonds, whereas a.s.r. has a larger allocation to CIUs. Smaller insurers such as Univé, TVM and Bovemij invest the majority of their portfolios in CIUs. NH van 1816 stands out for its relatively large allocation to equities.
Figure 7: Investment mix of selected insurers
What’s next?
Milliman Benelux has developed an interactive application to efficiently compare the metrics of insurers, as disclosed in their QRTs. If you would like to learn more and get free access to this tool, please follow the link https://apps.nl.milliman.com/ or send an email to [email protected].
If you have any questions or comments related to the information above, or if you are interested in learning more about Milliman and our services, please contact your usual Milliman consultant.
1 This analysis is based on direct writers only. Reinsurers were excluded from the analysis.
2 TThe data for individual insurers included in this briefing note has been sourced from Solvency II Wire data and company-disclosed SFCRs and QRTs. The data are available via subscription from https://www.solvencyiiwire.com/solvency-ii-wire-data-demo/.
3 Insights into the SFCRs of Dutch health insurers are described in the briefing note at https://www.milliman.com/en/insight/2025-sfcr-health-netherlands.
4 a.s.r. (2026). SFCR ASR Schadeverzekering N.V. 2025, p. 42. Retrieved 7 October 2026 from https://downloads.asr.nl/pdf/2025-asr-schadeverzekering-nv-scr.pdf?name=SFCR%202025.
5 Achmea and NN have been excluded from this section because they use partial internal models.